CL Macro and Micro Technical Pattern
- Pavan Kulkarni
- Feb 28
- 5 min read

This article is for Intermediate to Advanced Traders who understand basic Price Action.
One of the best things we do as traders is document the best Orderflow Patterns that result in a great move. I have to admit I missed a great Trade although the Trade was in the plan but certain rules prevented me from executing anything on CL. Since am talking about rules, let me just give you what my requirement for execution is. I can execute my first trade for the day on CL only if the instrument has given a classic Bias Structures from Trends or Ranges. If I do have to execute a Trade on CL without these classic structures in which case it will be Trend Reversals or Bias from Range Breakouts or Breakout Failures, Failing, then I need to have some Profit or Risk capital made for the day from other instruments like NQ or GC. So, in this case, I was stuck in the second scenario where I did not have any trade during the day to cover my stop for CL. I have been burned by CL too many times and I do not like when it grinds, hence the rule.
Now! Coming to the technical part of this Instrument, am picking one of the best days and putting the analysis and premise behind my setup out there. The Daily Time Frame on the Crude was trending strongly towards the Upside. After a strong rally, DTF Resistance within the Trend was tested and a Pullback was observed. The Pullback was clearly corrective and weak as shown in the chart.

HI itself has a great Range Structure within where a good Risk to Reward Short Setup was observed. Following HI, where I gave a Swing towards the Upside on Hourly Time Frame (HTF) which changed the Structure from Bearish to Bullish with confirmation. In the below Chart of HTF, 1234(4 coinciding with I from DTF) gave a Downside Bias from the Structure within the HI from DTF that I mentioned earlier. That Downside Structure was then followed by Swing 45 which strongly violated 3 and closing above the Entire Bearish Structure giving a Change of Structure and with that Change in Bias.
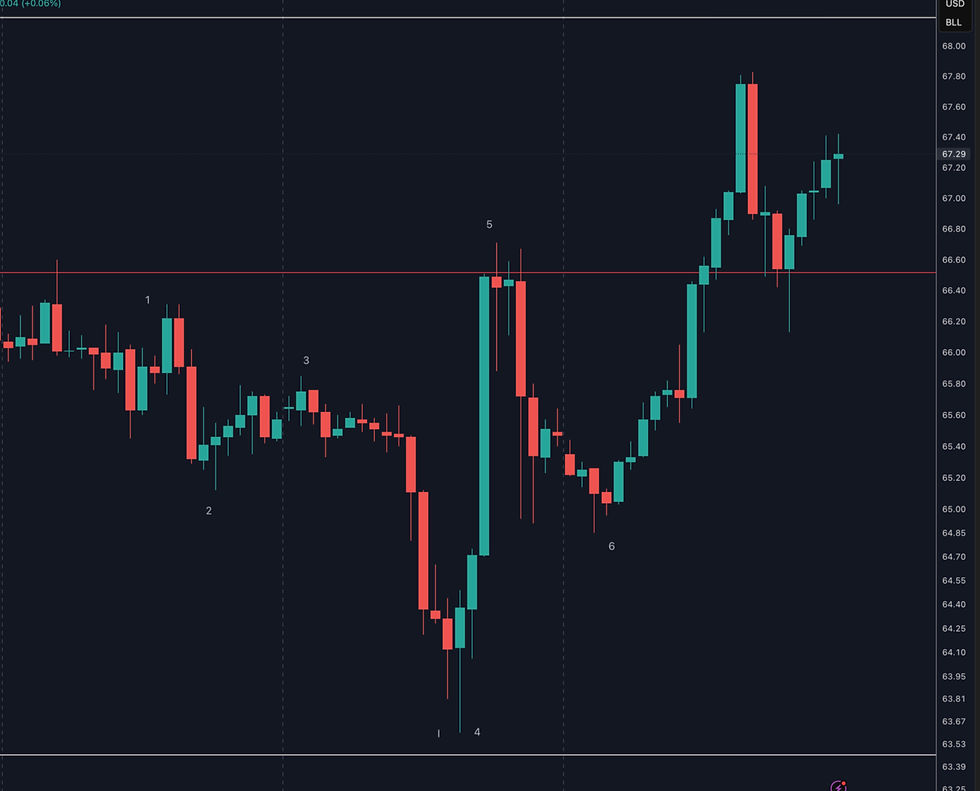
In any other scenario, the Change of Bias does not happen immediately as the Structure Changes. We need Change of Structure and Confirmation of the Reversal or Structure Change by giving any kind of technical Patterns like a Trend to confirm the change in Bias. But here, we bring the Context into picture. We need to be aware that DTF has been in a strong Bullish Trend. Following the test of the DTF Resistance, DTF started to Pullback. Now, if the Pullback was strong and the bearish candles were solid, then I would clearly wait until DTF Pulled all the way down to a Swing Low to reassess the Bias. But in this scneario, HI did not change any structure on DTF. It was a shallow Pullback and HTF is starting to Realign in the Bullish direction. It's always good to keep in mind that if the Lower Time Frame Bias is against the Higher Time Frame Bias, and Lower Time Frame starts to Struggle to move in the direction of the Bias and realigns in the direction of the Higher Time Frame Bias, then we need to validate this change immediately instead of waiting for confirmation. In this case Higher Time Frame being DTF and Lower being Hourly. We can wait for confirmation in which case the Expectancy reduces but the Probability increases. Now, it's upto you to understand your personality and decide whats favourable for you. A Higher Expectancy or a Higher Win Rate? Here, since I consider DTF context and validated this Change of Structure, the Hourly is now Bullish. Again, the Pullback 56 threw me off the chart because that seemed strong and I got off watching CL and started watching NQ which also had a great Setup presented on the same day. CL pulled all the way down to 6 and then started to show some buying. The Buying came at the test of 2 from the chart which posted a Higher Low compared to 4. We now move to Lower Time Frame which is the Execution or Trading Time Frame (TTF) and in my case it's 5 Mins. I wait for HTF to form a Swing along with my TTF establishing a Bullish Technical Structure.

The above is a 5 Mins TTF Chart. An aggresstive Trader can enter anywhere between 6 from the HTF Chart till the 3rd Circle. For me, the best place to enter would be the third circle at C. Premise behind the idea goes like this. Starting from 6 on HTF Chart, TTF started to rally. The First circle comes after clearing a major breakout to the Downside on TTF. Following that, the price established an Up Trend and thus the second circle appears as an Entry which forms a Trend Pullback. At this moment, we are still in Pre-Open for UK. So no executions happen and even if it did fall in my execution period, I need something a lot more convincing of orderflow.
So as we move further up, from A, I see a strong breakout. This breakout came after TTF formed a minor Range and tried a couple of Breakout Failures which Failed and the rally continued. This is Failure of Breakout Failure. Two NEGATIVES.! As A broke towards the Upside, a strong selling came in that pulled the price from B to C clearly breaking A. Now considering the Pullback on HTF, we need to see immediate acceptance of break of A and continuation for change. But that didnt happen. Instead, all along the chart from the low, this is the first time the Price has violated the intraday Structure for me. Now those are my Sweet Spots to enter. DTF Aligned. HTF Aligned. HTF Swing Aligned and TTF bringing in Bearish orderflow and Trapping them as the Bulls reappear just below A. The Risk is extremely small at about 10 ticks and the reward was at leat the HTF High or DTF High. This was a great chart and obviously goes right into my A game category although the Trade Grade is B or Lower as it is not coming from direct alignment of DTF and HTF Technical Structures. We have failure of a HTF Bearish Structure giving this Bullish Bias.
This is the thought process behind a great Trade. This may look complex, but once you think in context, the decision becomes simple and the thought process just flows. You might even be stopped out but the premise always presents with Higher Expectancy over multiple executions. I do not want to talk about Exits as without proper context and statistics and understanding of your own personality, I may incept a kind of benchmark in your mind which can play against your trading. Exits are extremely personal and they vary based on temperament, personality and our need for gratification and also various other such psychological aspects.

Comments